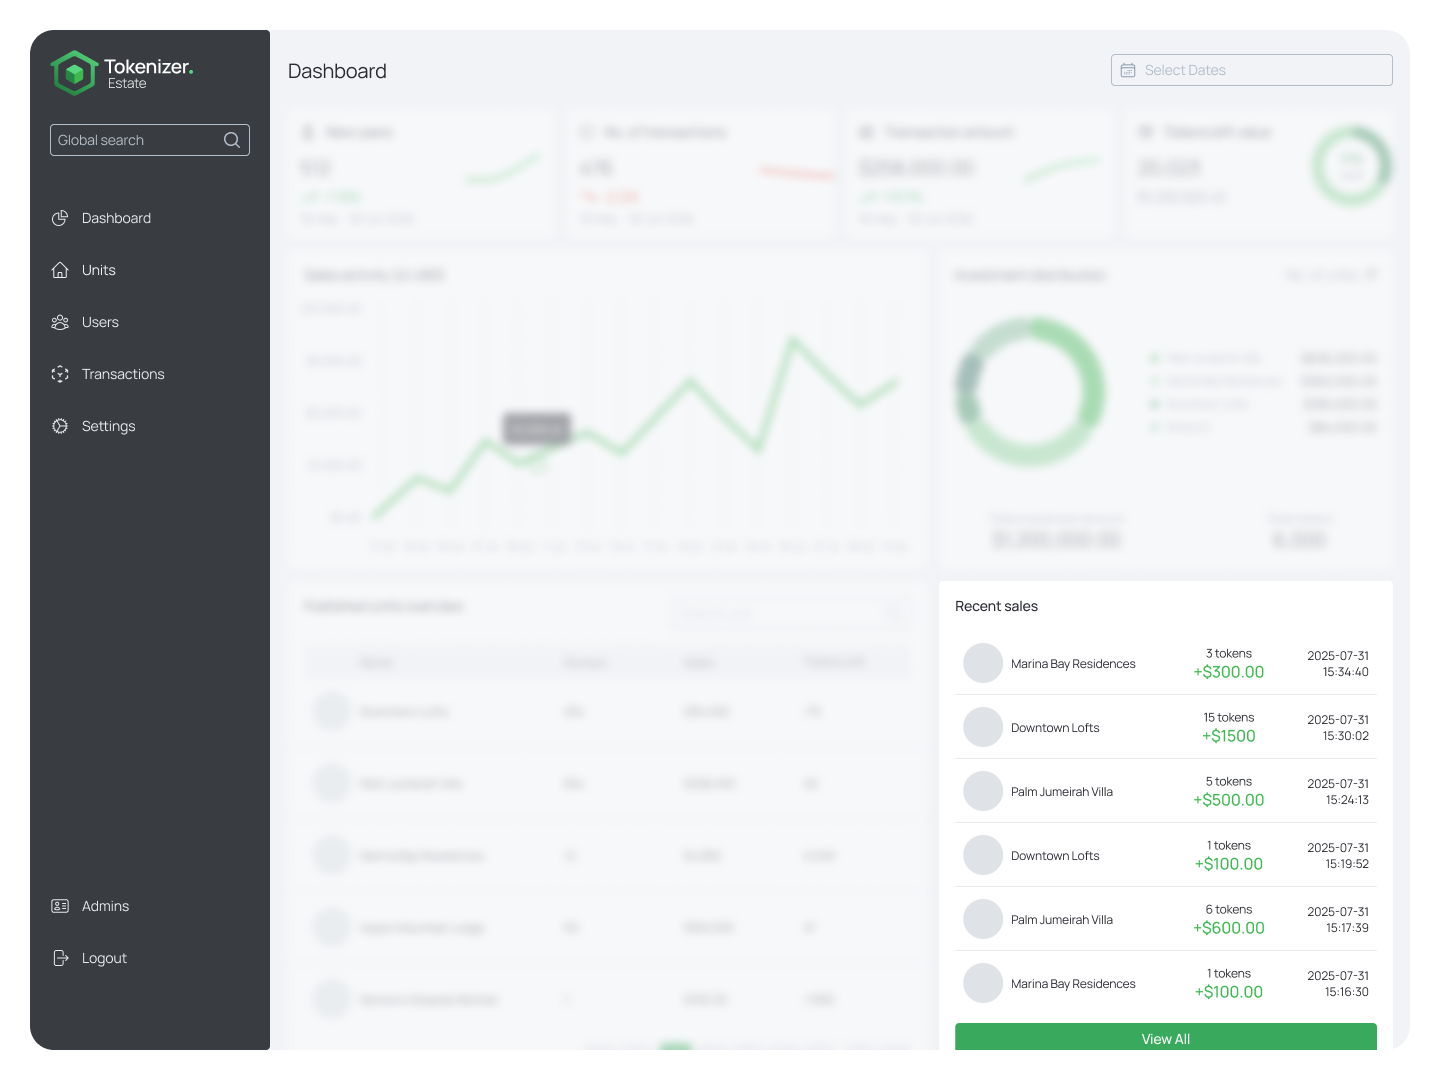
3.2 Dashboard
The Dashboard is the central analytics and monitoring hub of the Tokenizer.Estate admin panel. It provides real-time insight into the platform’s activity and performance across users, transactions, and investment units.
3.2.1 Key Metrics
At the top of the Dashboard, you’ll find four high-level KPIs that reflect overall platform performance:
- New Users – Number of users who registered within the selected date range. The percentage change is calculated relative to the previous period.
- Number of Transactions – Total completed blockchain transactions for all units for the period.
- Transaction Amount – Total USD equivalent value of all token purchases during the selected period.
- Tokens Left Value – Combined value of remaining unsold tokens in quantitative and monetary terms (in dollars), as well as the percentage of tokens sold.
The reporting period for the first three of the key metrics can be adjusted using the date picker at the upper right corner of the page.
3.2.2 Graphs and Visualizations
- Sales Activity Graph – A line graph displaying the transaction amount over time, helping identify peak activity periods or sales trends.
- Investment Distribution Chart – A donut chart showing the proportional allocation of tokenized assets across published units. Hover over each section to see the investment amount per unit.
3.2.3 Unit Summary
The Published Units Overview table displays a quick summary of each live real estate unit:
- Name – Unit title with a quick view icon.
- Owners – Number of users who have purchased tokens for this unit.
- Sales – Total revenue generated from token sales for that unit.
- Tokens Left – Remaining tokens available for purchase.
You can search by unit in this block by typing in the search bar at the top right corner the name of the unit.
This section helps identify which properties are performing well and which may require additional marketing efforts.
3.2.4 Recent Sales Feed
On the right side, the Recent Sales feed provides a chronological list of the latest token purchases:
- Unit Name
- Token Quantity
- USD Amount
- Timestamp
Under the list of transactions, there is a View all button that leads to the Transactions page.
This is useful for quickly verifying transaction activity and catching any unusual purchase patterns.

3.2.5 When No Data Is Available
If no data has been collected yet (e.g., during initial setup), placeholder cards and empty state illustrations are shown. Once users, units, or transactions are active, the dashboard auto-populates.